Newsletter 28 – Cycling
- Posted by IanMuttonAdmin
- On July 1, 2021
- Bradfield Park, Cycleway, Harbour Bridge
Sydney Harbour Bridge: Cycle usage – so you think cycling is increasing? Don’t bet on it!
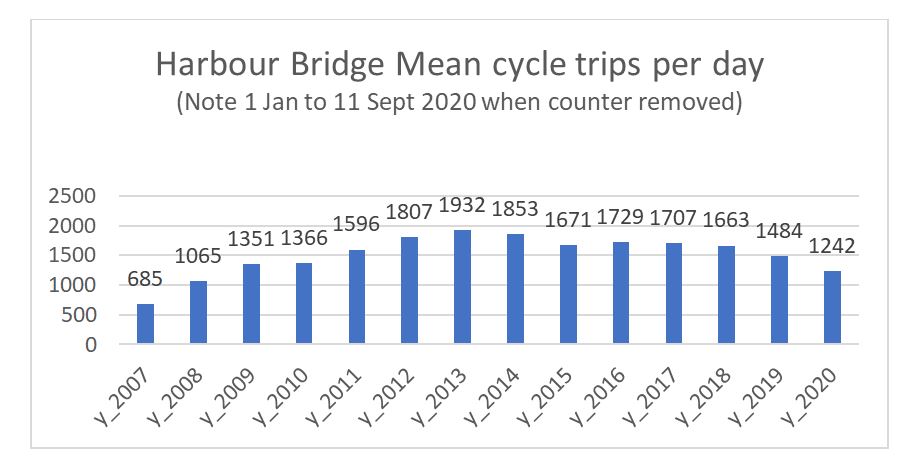
Between 2007 and 11 Sept 2020, Transport for NSW used a bicycle counter on the Harbour Bridge cycleway to collect data on the number of cyclists.
- The counter measures the cycle trips per day.
- As a cyclist usually goes both ways – the number of cyclists is half the number of cycle trips.
- The counter was removed on 11 Sept 2020

The mean number of cycle trips per day declined from 1,932 in 2013 to 1,484 in 2019
- a decline of 23% per day.
In other words, the number of cyclists per day declined from 966 to 742
- a decline of 224.
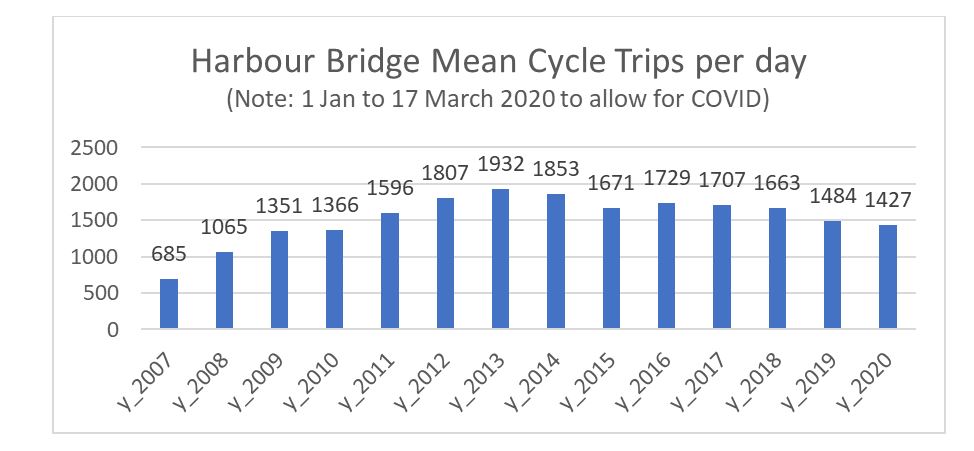
To allow for COVID taking effect in March 2020, the mean trips per day for 2020 were recalculated using 1 Jan to 17 March 2020.

The mean number of cycle trips per day continued to decline in 2020.
It declined from 1,932 in 2013 to 1,427 in 2020
- a decline of 26% per day.
In other words, the number of cyclists per day declined from 966 to 714
- a decline of 252 per day.
Cycle Trips on weekday
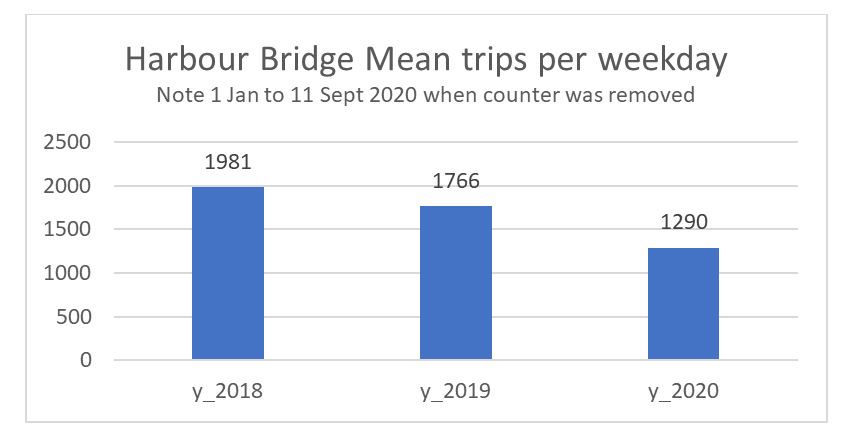
The mean trips per weekday from 1 Jan 2018 to 11 Sept 2020

Over the past three years, the number of cycle trips per weekday declined.
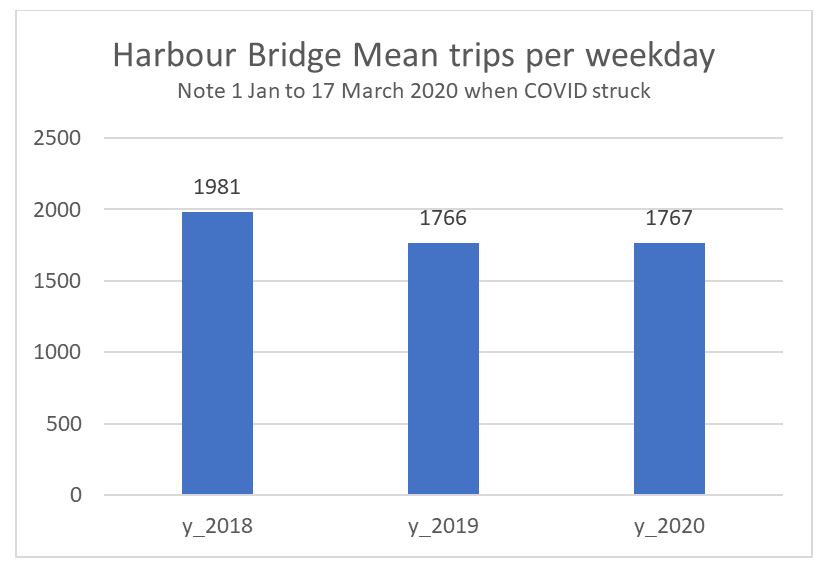
As COVID struck ~17 March 2020, we will look at the decline between 2018 and 2019.
- The number of cycle trips per weekday declined from 1,981 in 2018 to 1,766 in 2019
- a decline of 11% per weekday.
In other words, the number of cyclists per weekday declined from 991 to 883

To allow for COVID taking effect in March 2020, the mean trips per day for 2020 have been recalculated using 1 Jan to 17 March 2020 and are similar to 2019.

0 Comments